")
")

In a Linux server it is essential to control the network correctly, so that no program makes excessive use of it, does not slow down the general operation of the operating system and the network itself, in addition to controlling what the network traffic is doing. There are a large number of tools to monitor the network for different operating systems, today in RedesZone we are going to talk about the most interesting network monitoring tools for Linux systems, some of them run through the console, and others with the graphical user interface.
Console monitoring tools
The following tools that we are going to show you are all in the repositories of the main Linux distributions, we have used Debian and we have used the official repositories. Normally all these tools that we are going to teach you are not installed, so we will indicate how we should install each of them.
Iftop
Linux users are usually familiar with top, a tool that allows us to monitor running system processes, CPU, RAM and swap load among other options. Iftop is an application similar to top, but it is specifically focused on network monitoring. Iftop will allow us to know a large number of details regarding the network, such as the bandwidth consumed, the TCP / UDP connections that we have established, IP addresses and port and much more information.
To install this tool we must execute the following command in a terminal:
sudo apt install iftopOnce installed, we can execute it simply by putting "sudo iftop" in the terminal, it needs superuser permissions to run, otherwise it will tell us that it cannot find the command.
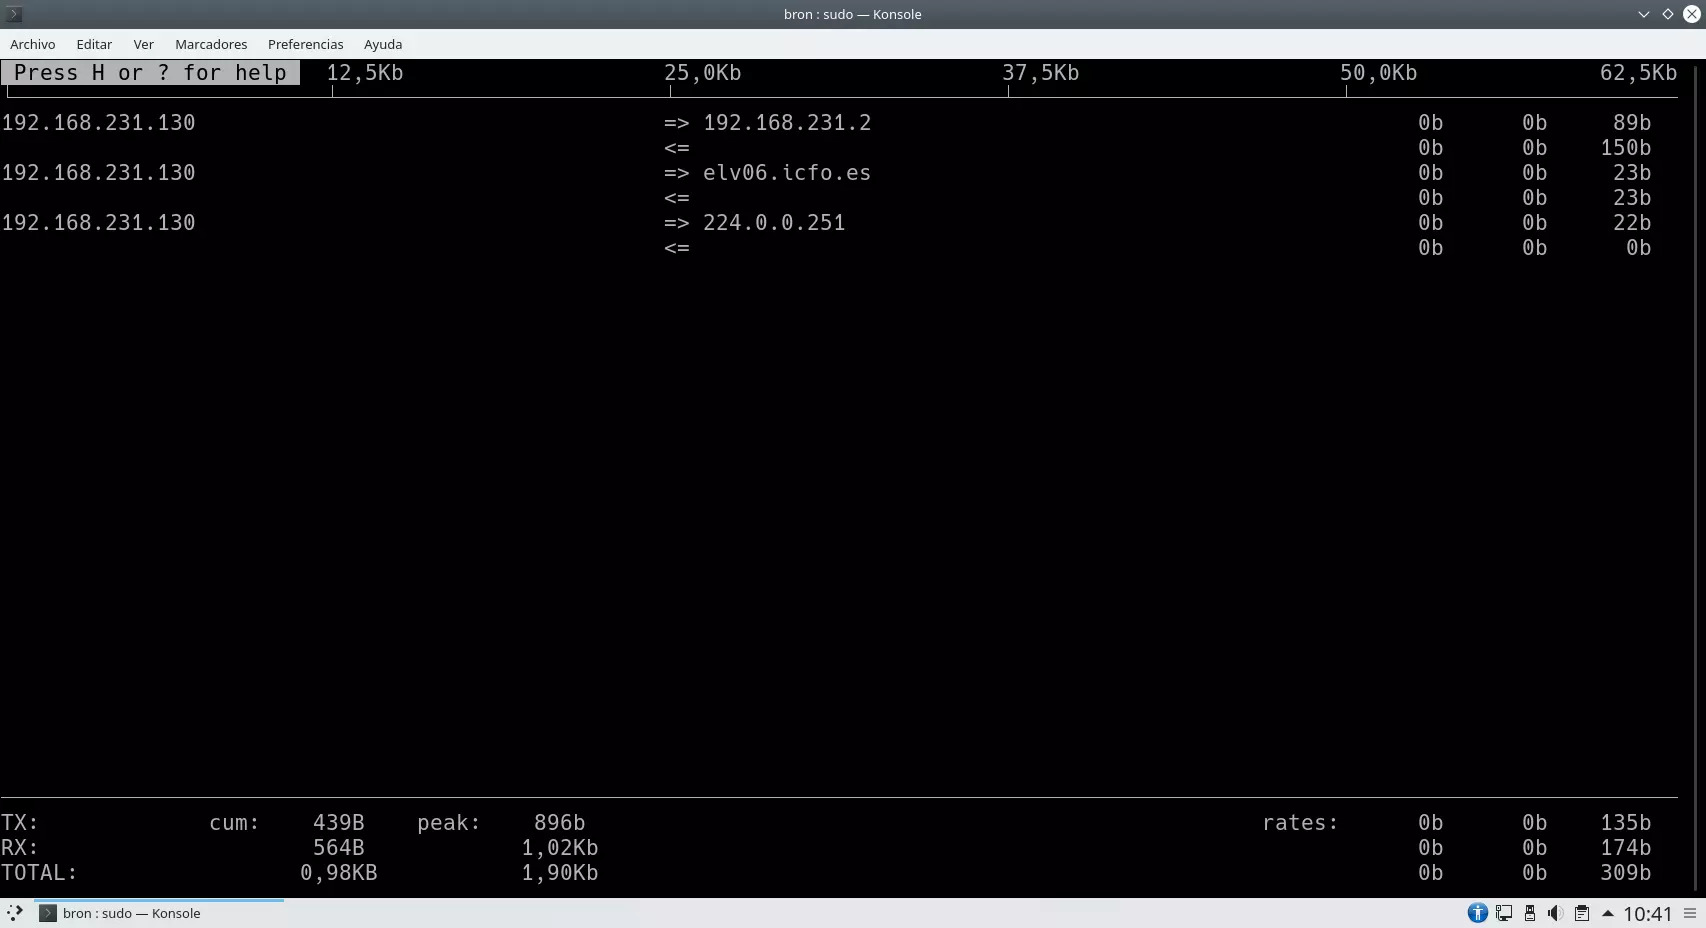
When closing the program, we will be able to see the interface that it has monitored, the IP address and the MAC address:
bron@bron-debian:~$ sudo iftop
interface: ens33
IP address is: 192.168.231.130
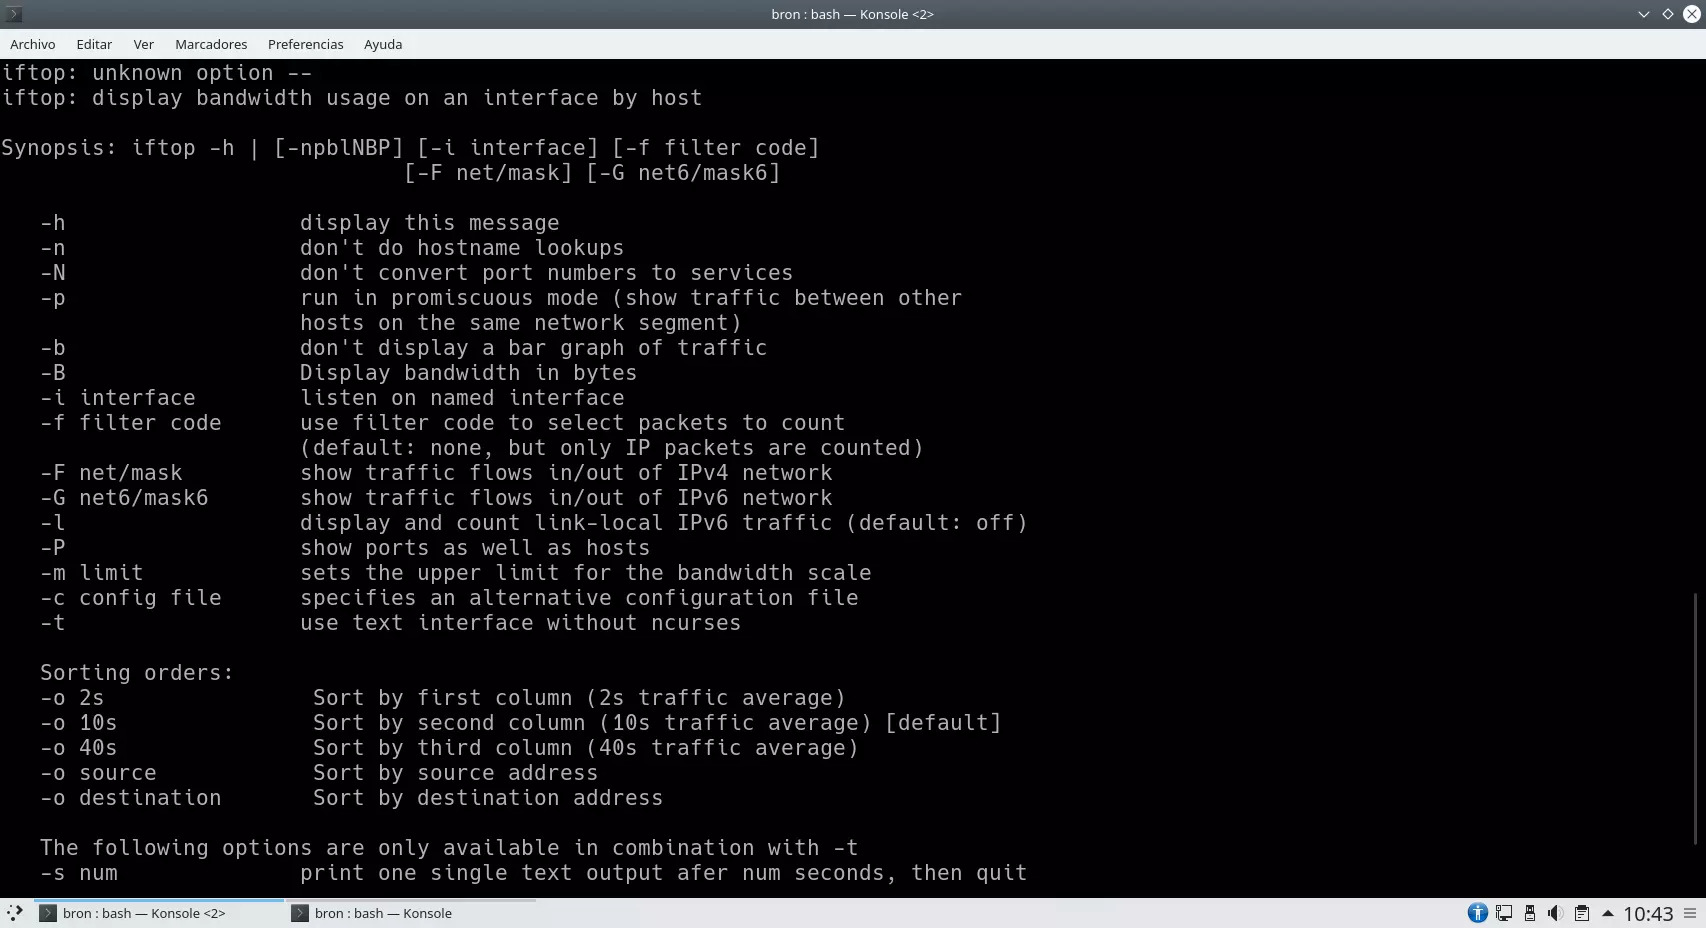
MAC address is: 00:0c:29:12:1e:8dSome of the options that we have available when executing this program is that we can not resolve the IP addresses, not convert the port numbers into services, and many other options available such as listening on a certain interface, showing the bandwidth In bytes instead of bits, show only incoming and outgoing traffic from IPv4 or IPv6, etc.
As you have seen, this tool is really useful and will allow us to quickly and easily know everything that is happening in the local network of our server.
Vnstat
Vnstat is a network monitor that is included, by default, in most Linux distributions, but in the Debian distribution it does not come by default, so we will have to install it. This program allows us to obtain real-time control over the traffic sent and received in a period of time, chosen by the user.
To install this tool we must execute the following command in a terminal:
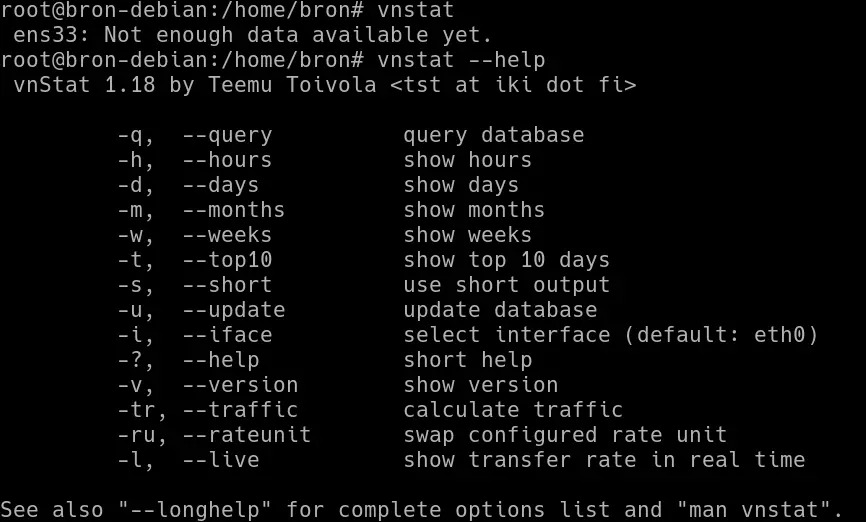
sudo apt install vnstatIf we install this tool and run it right away, it will indicate that there is not enough information collected yet, so we will have to wait until it is available. Regarding the configuration options of this program, we will have the possibility to consult a database, show hours, days, months, weeks, the top of the last 10 days, update the database, calculate traffic and many more options available.
If we execute "man vnstat" we will be able to see the rest of the configuration options that we have available with this very complete program, being able to export all the information in XML format and even JSON, in addition, we will have the possibility to show the statistics of an interface or of several jointly.
Iptraf
This application will provide us with a large amount of information at the network level, it will allow us to see the same information from the two previous tools and even more, iptraf is not installed by default in Linux operating systems, therefore, we must install it through the official repositories. To install this tool we must execute the following command in a terminal:
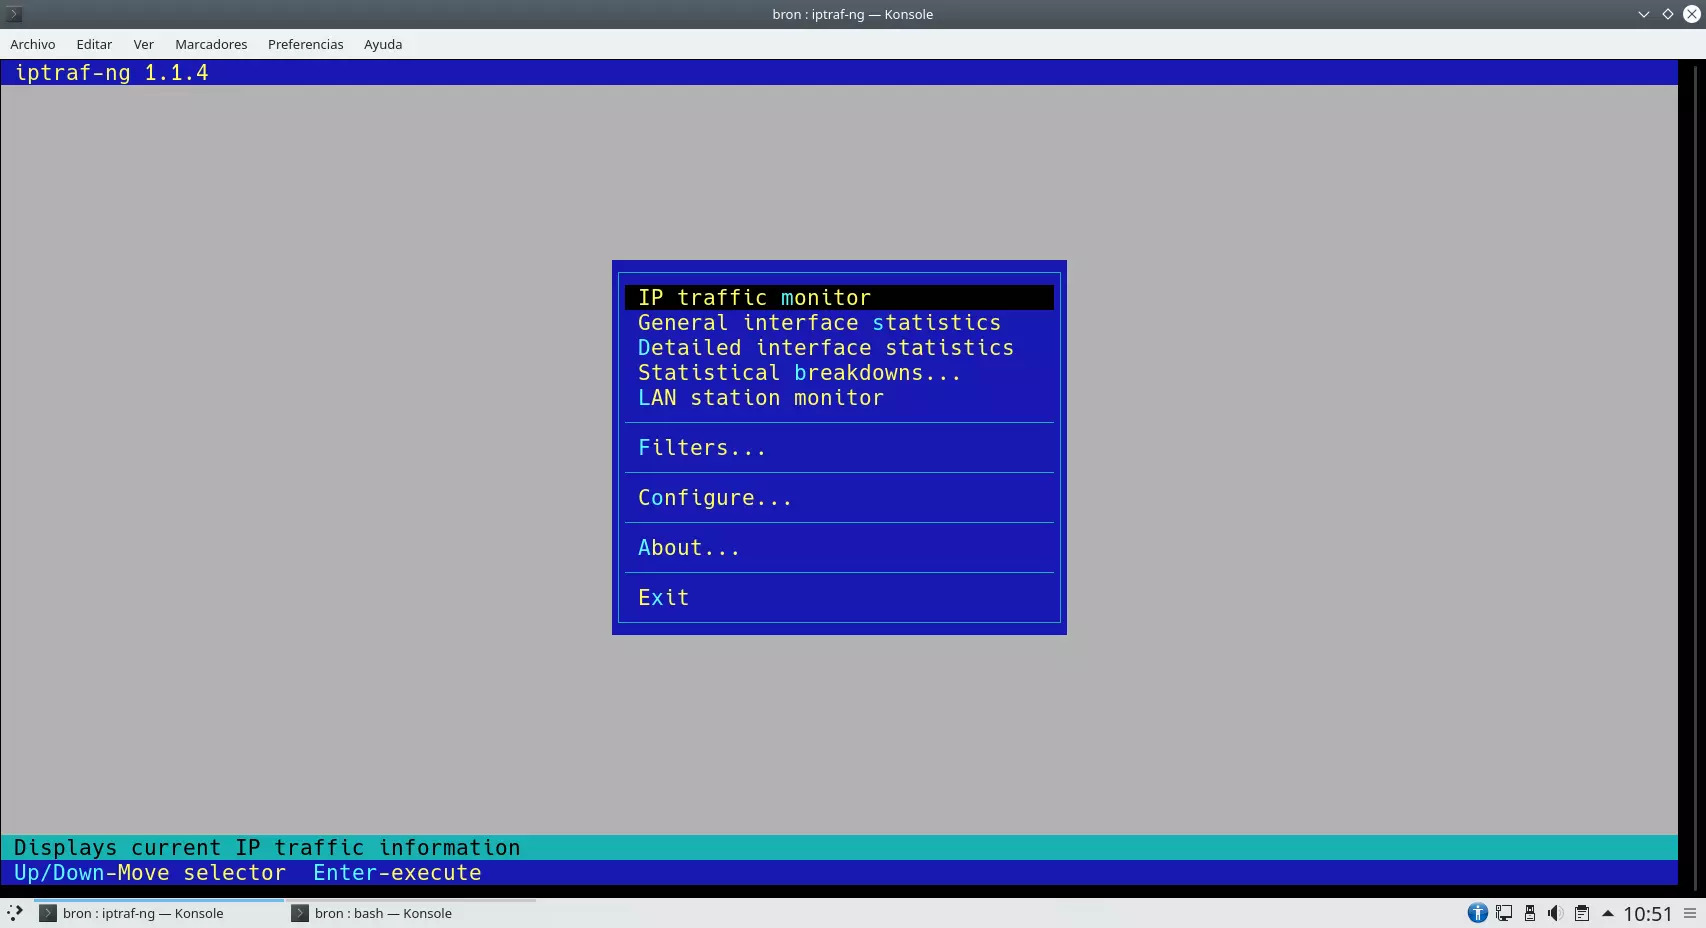
sudo apt install iptrafTo run this tool, we will have to run the command "iptraf-ng" with superuser permissions. Once we have done it, a blue menu will appear with different display and configuration options. We can select the following options:
-
Monitor IP traffic
-
See the general statistics of the interface
-
View detailed interface statistics
-
Fall statistics
-
Monitor the LAN
-
Filters
-
Settings
-
About the program
-
Leave
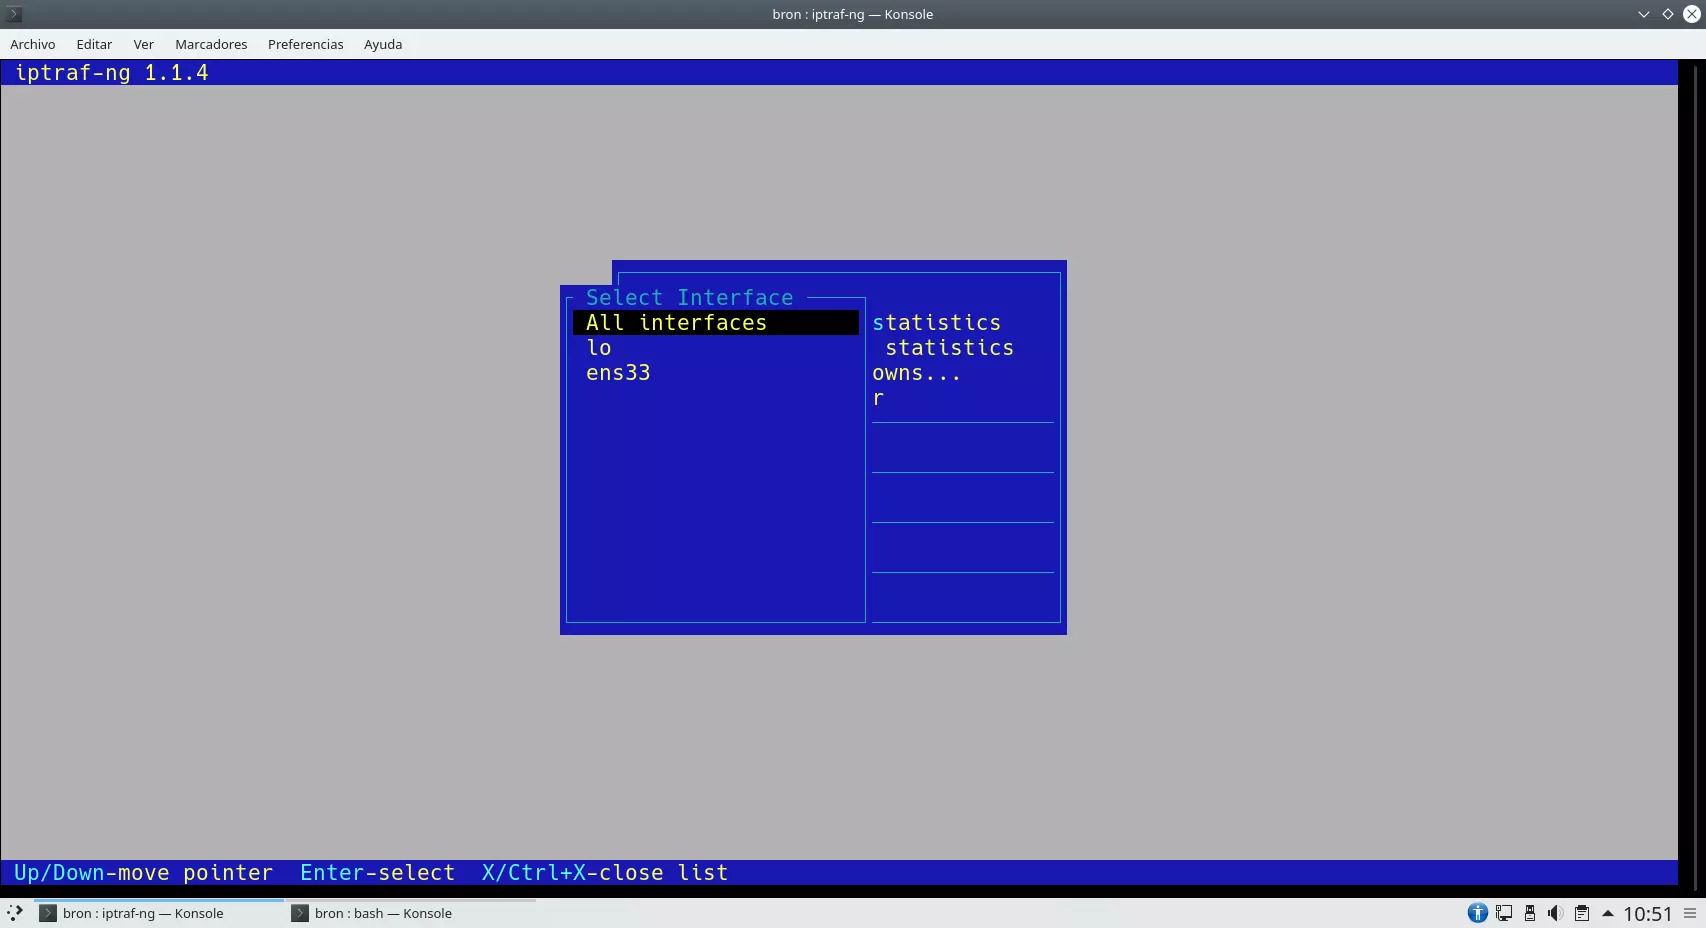
If we select the first option with the keyboard, it will tell us if we want to choose all the interfaces or only some of them, in this way, we can filter the IP traffic by a physical interface.
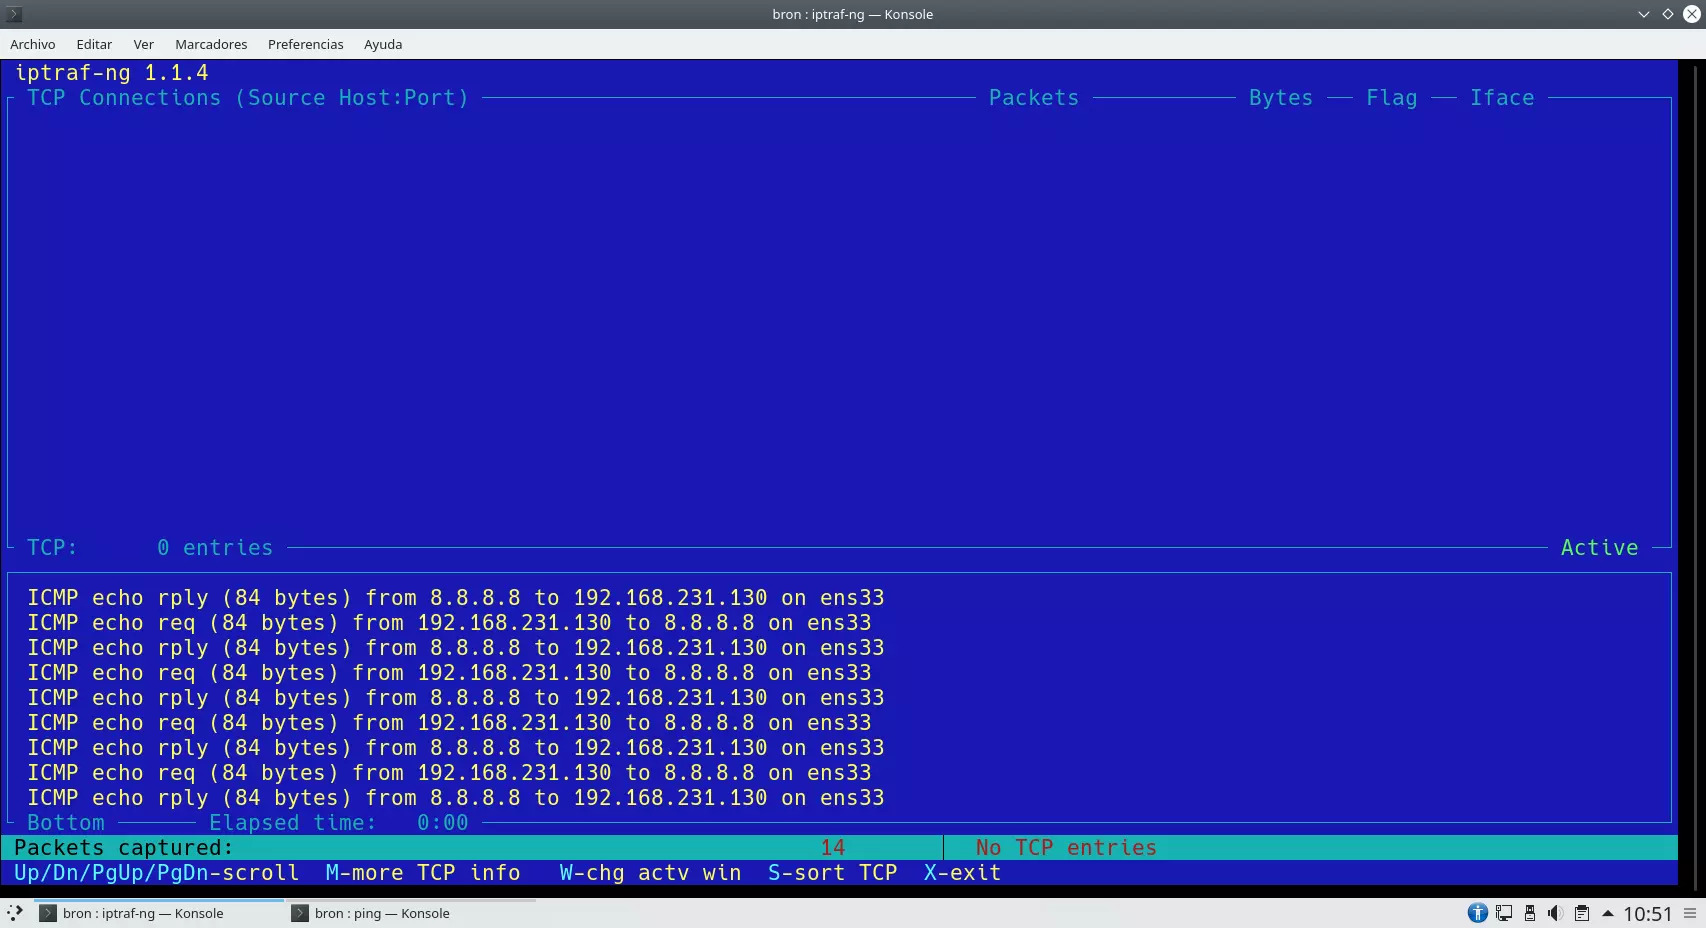
Next, we will get a monitoring system of all the network connections that we are currently making, we will be able to see the type of packet, source and destination IP address, as well as the physical interface.
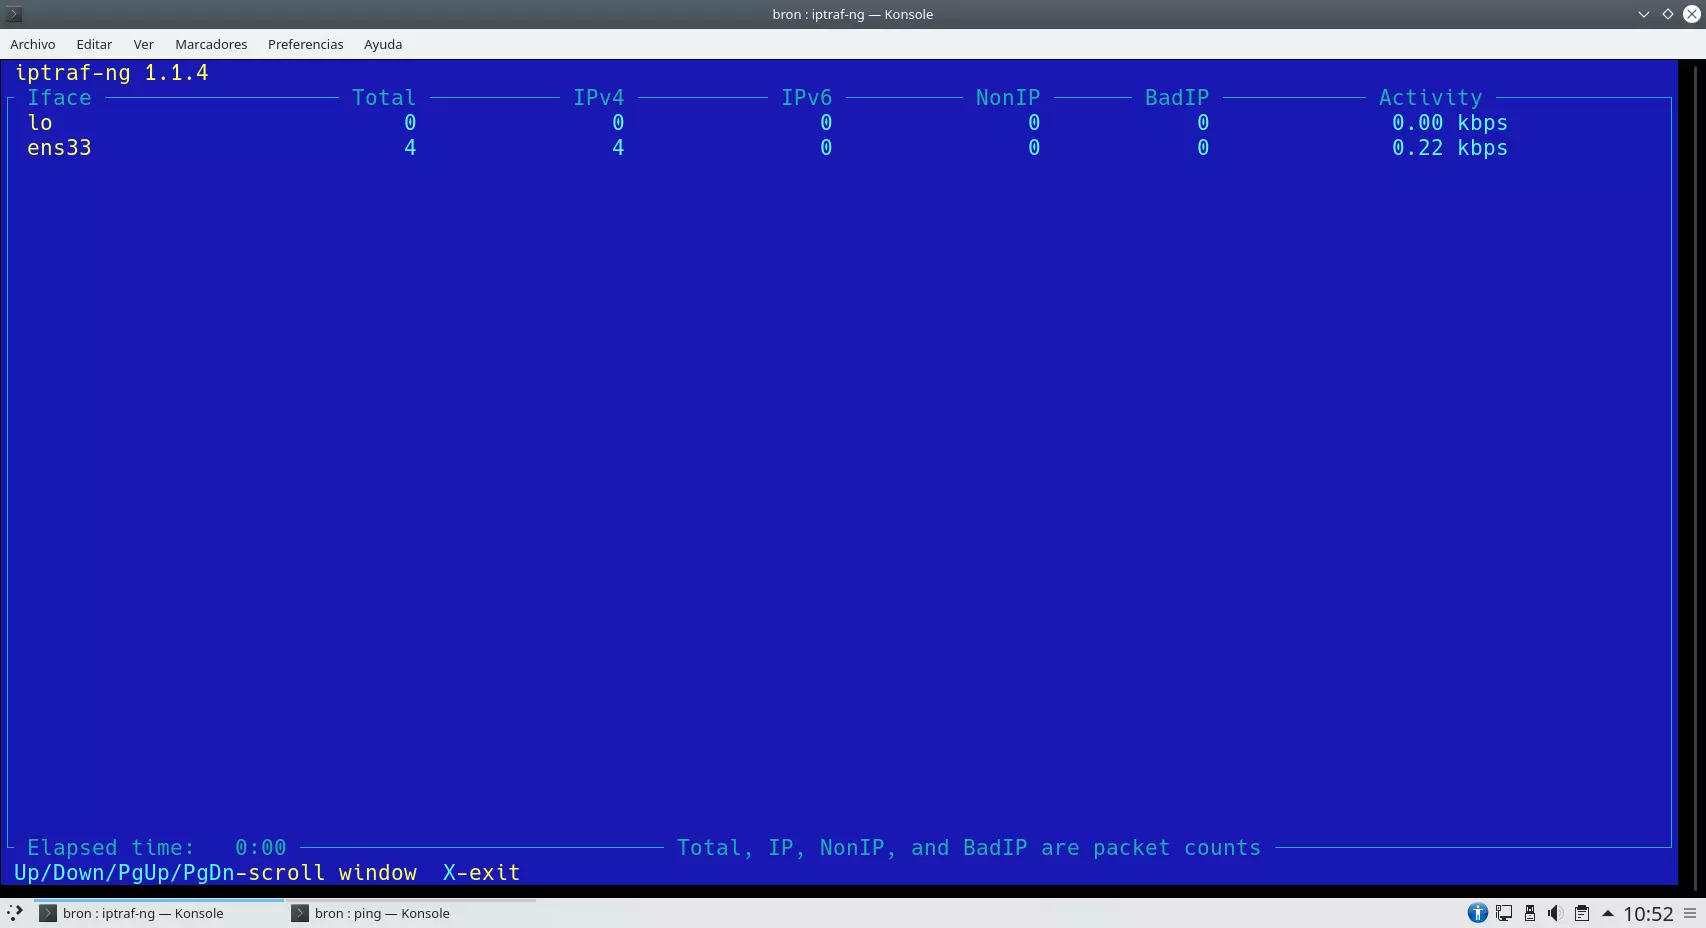
We will also be able to see the statistics of all the network interfaces of our server, packets received and sent, as well as the activity in real-time.
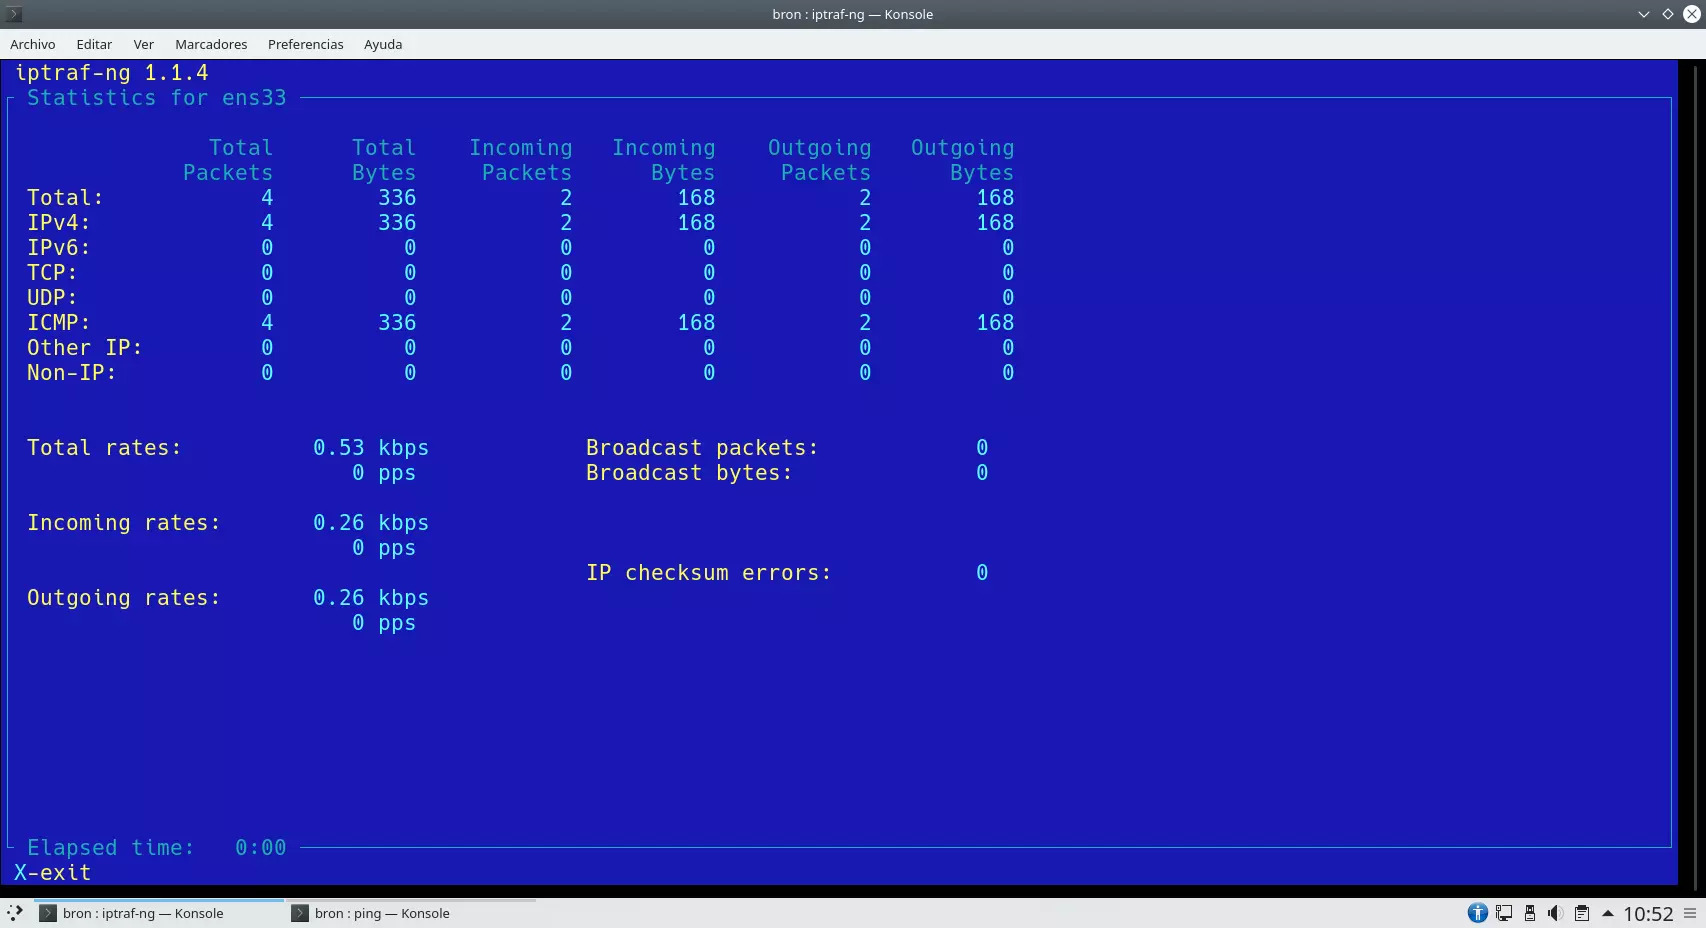
If we want to see more detailed statistics of one or more interfaces, we can also see it in the corresponding section. Here we can see the incoming and outgoing packets, of different types of traffic (TCP, UDP, ICMP, etc.) and much more.
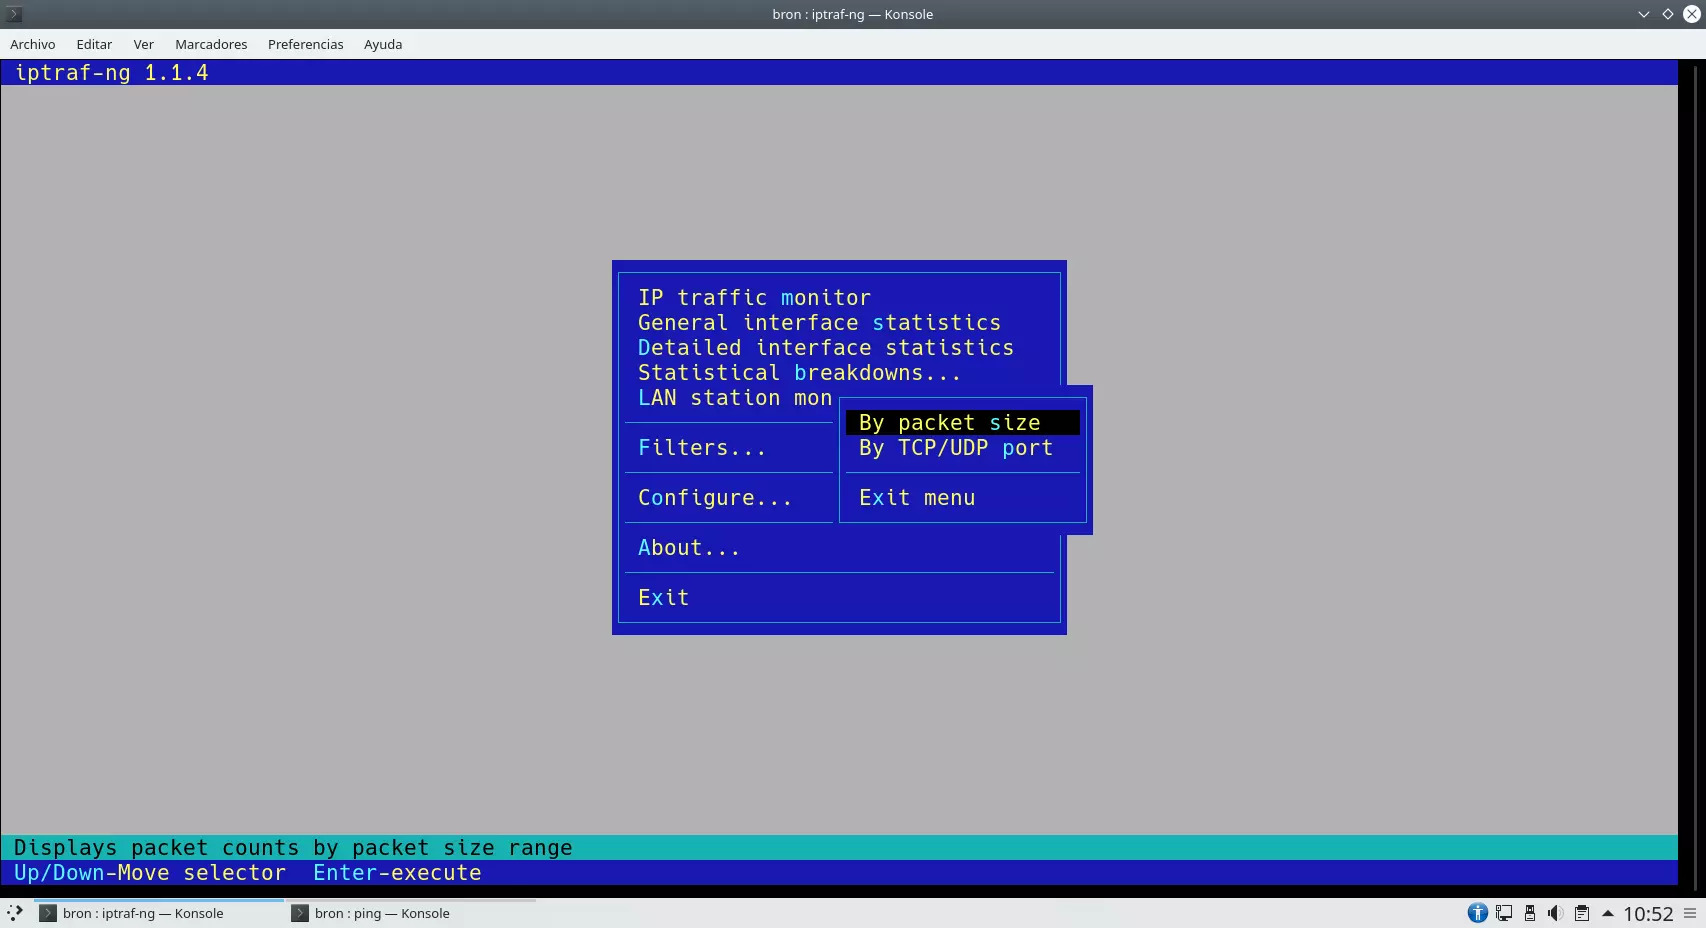
We can also configure filters, both by packet size and by TCP or UDP port.
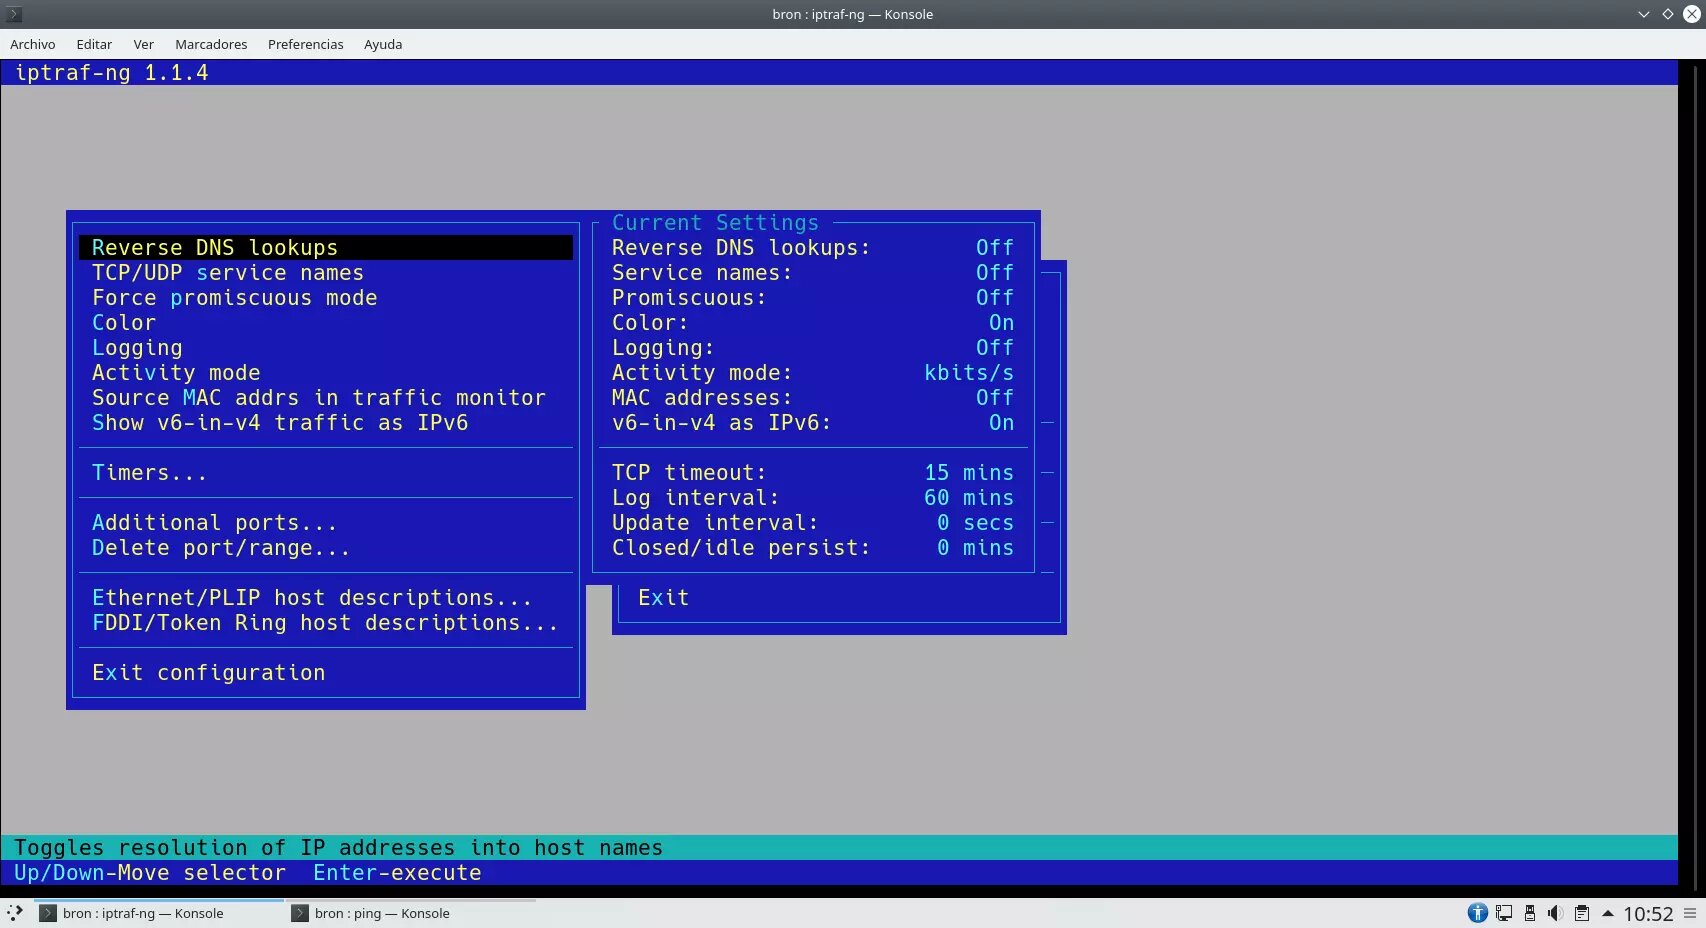
Finally, in the "Configure" section we will have the possibility to configure a large number of advanced parameters.
As you have seen, this tool is one of the most complete that currently exists to monitor the network of our server with Linux operating system.
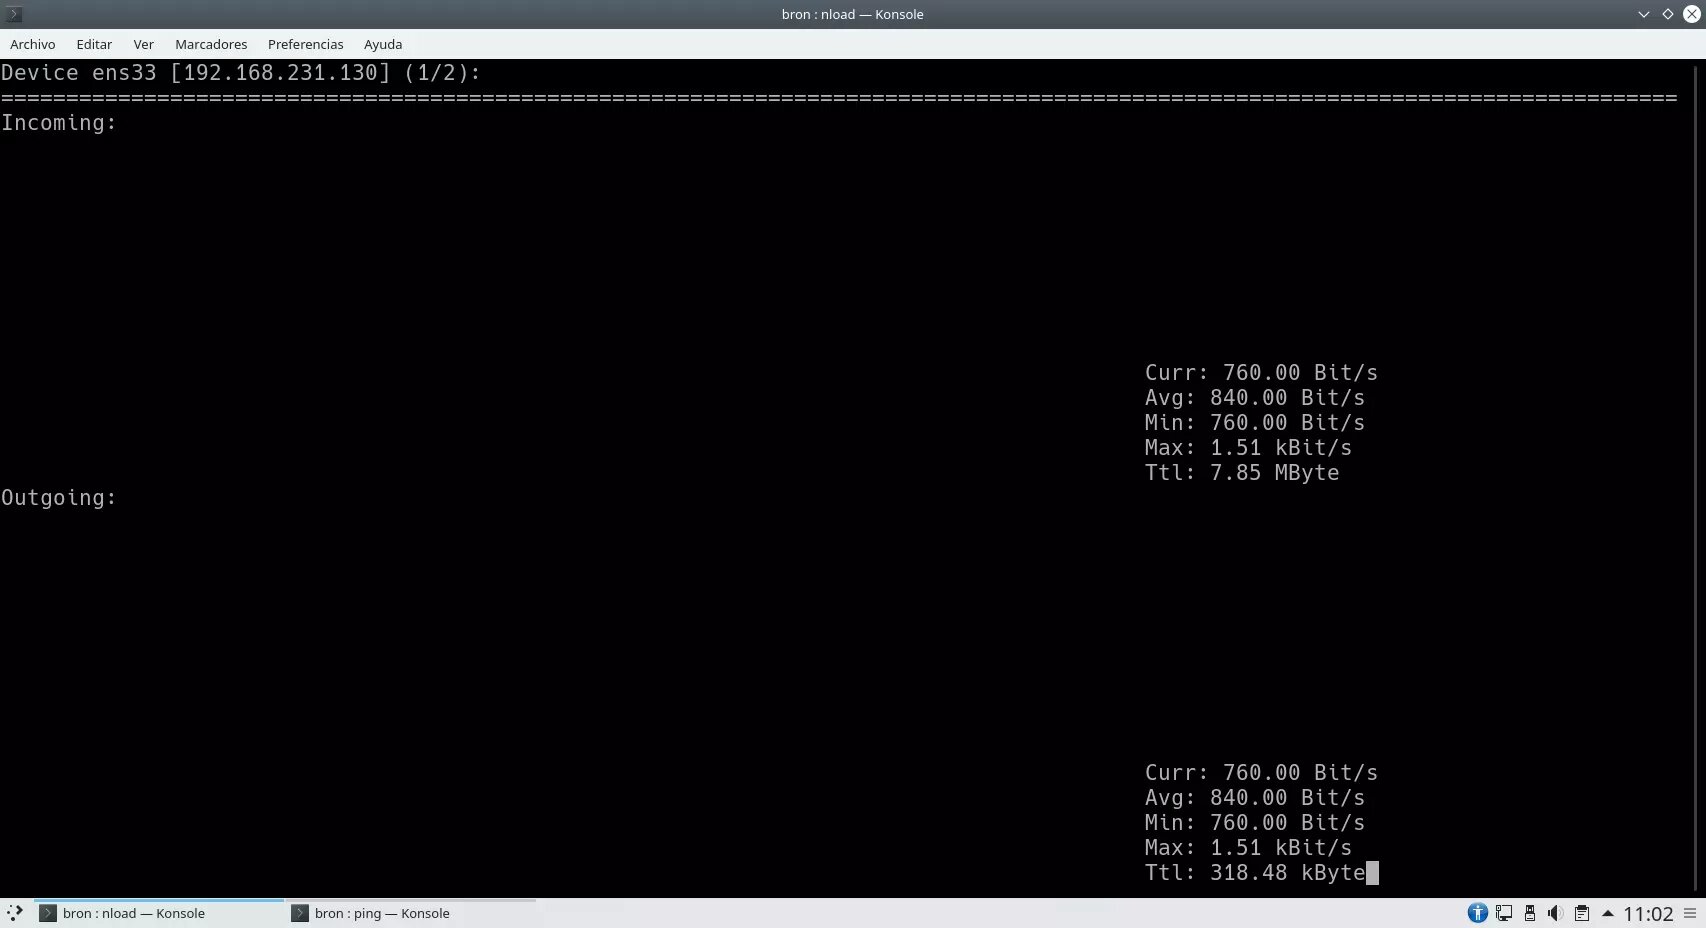
Nload
This tool is capable of drawing in ASCII mode a graph with the accumulated consumption of the network, we can also see the current incoming and outgoing speed, the average, minimum, maximum and TTL. It is a very simple but quite useful tool that will provide us with information on the bandwidth we currently have on the network.
To install this tool we must execute the following command in a terminal:
sudo apt install iptrafTo run this tool, we will have to run the "nload" command with superuser permissions.
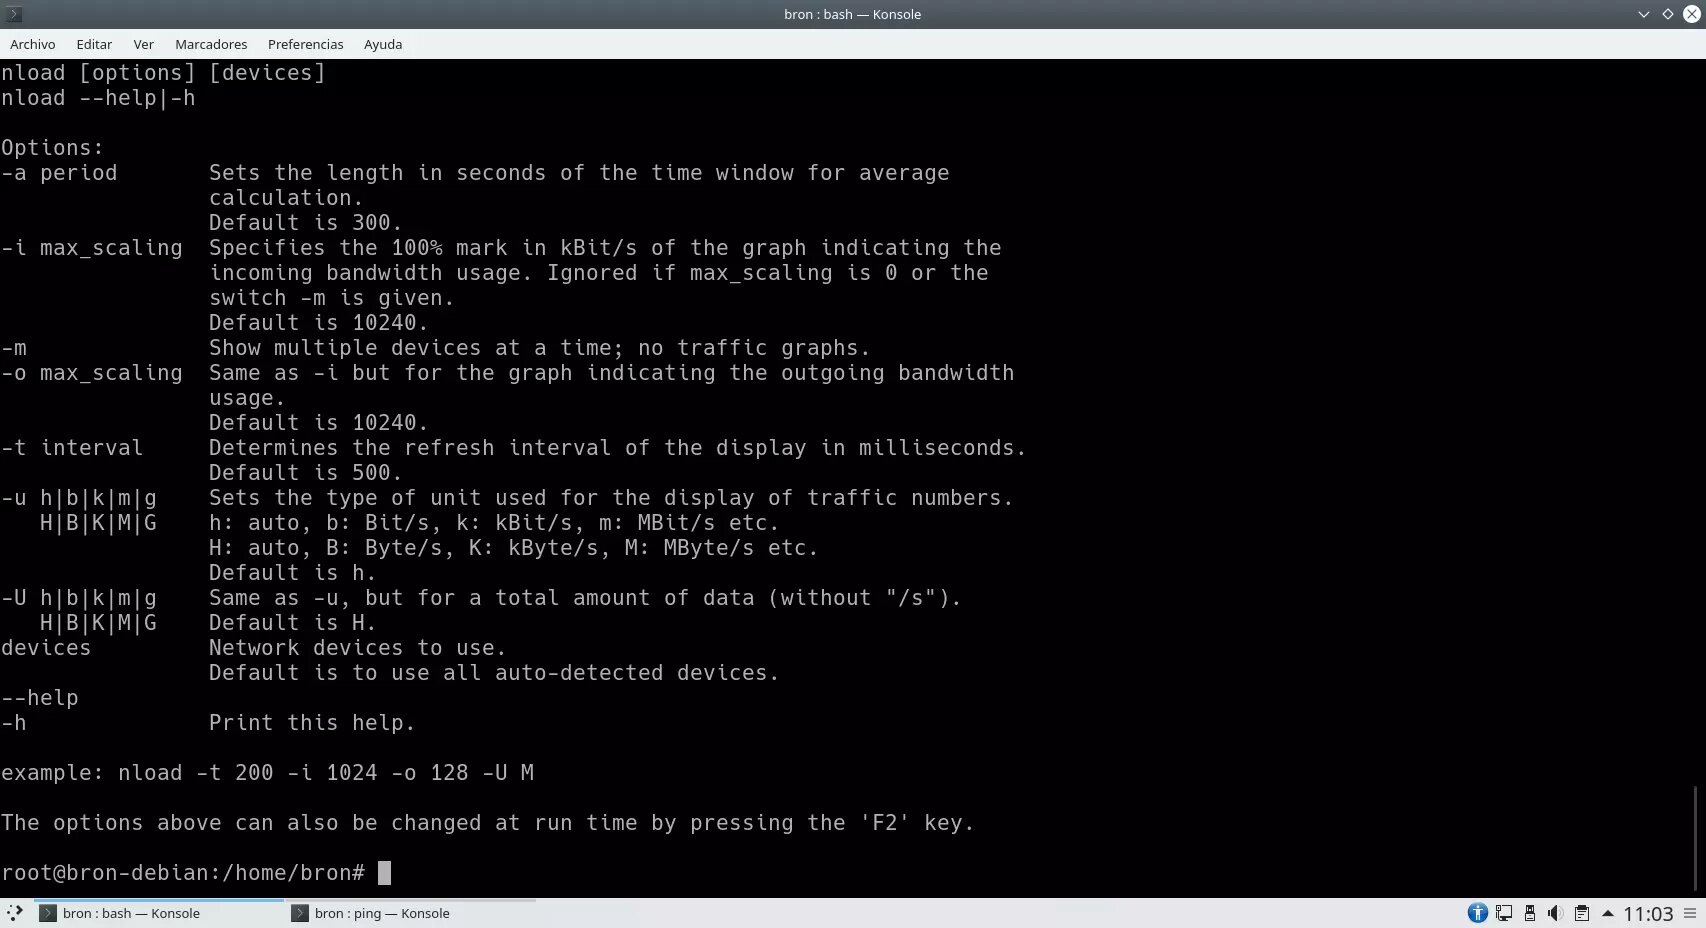
Regarding the available configuration options, we will be able to determine the time interval, select the type of measurement (bit/s, MB/s, etc.), and other basic configurations regarding the ASCII graphics.
As you have seen, although it is a very simple tool, we are sure that it will be very useful for you.
Dstat
A somewhat less known monitor than the previous ones, but one that is also very useful. This tool is used to generate statistics on the use of the operating system, both at the level of CPU, disk, RAM memory, as well as the local network. In fact, we can enable or not the network status and even choose the interfaces. To install this tool we must execute the following command in a terminal:
sudo apt install dstatTo execute this tool, we will have to execute the command "dstat" with superuser permissions.
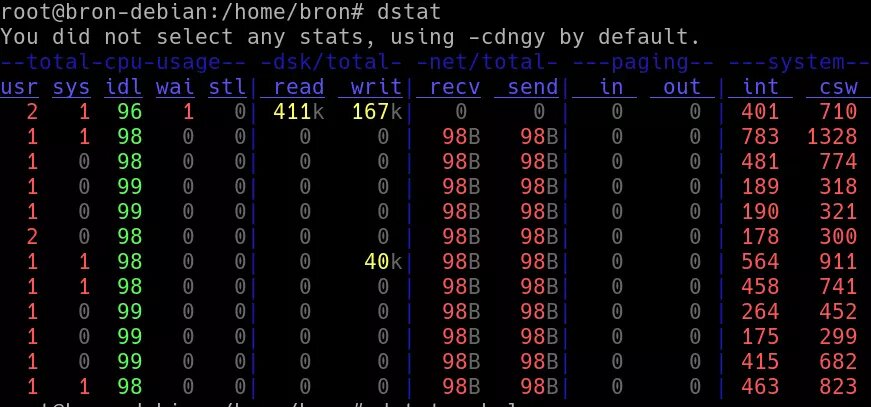
Regarding the configuration options, if we execute the command "dstat -h" we will be able to access all the available options.
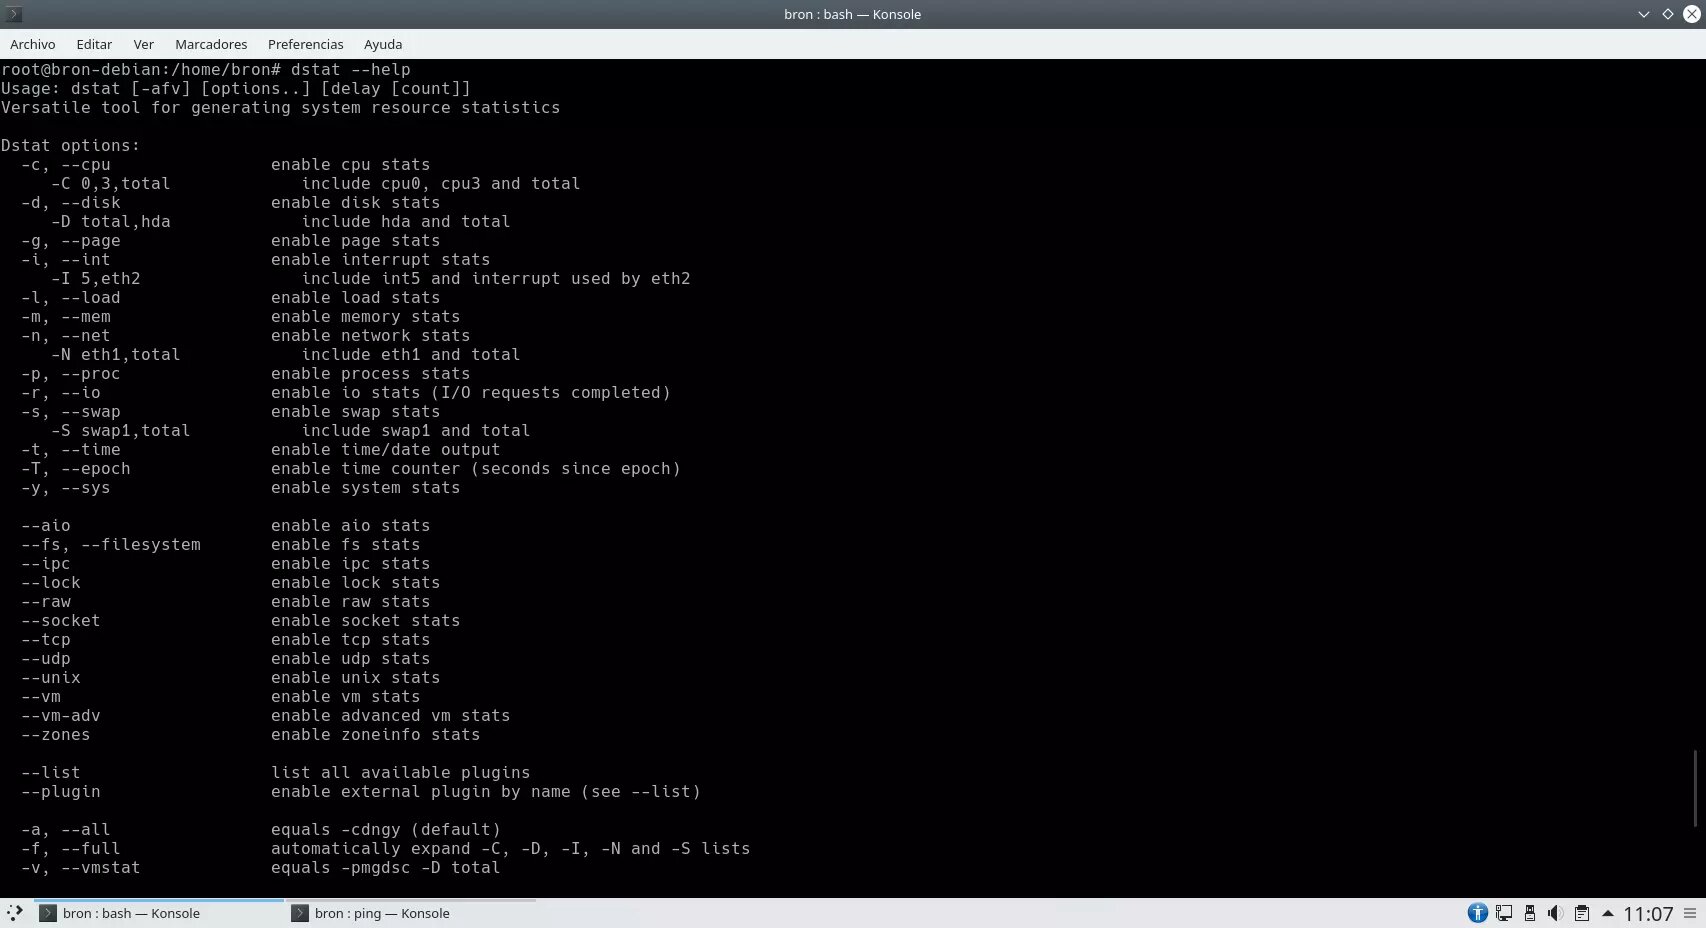
As you have seen, we can easily and quickly see the status of different parts of our operating system, and not only of the network.
Bwm-ng
This tool is very simple, we can obtain information from all network interfaces interactively, and we can even export it to a certain format to later consult it more easily on another device. To install this tool we must execute the following command in a terminal:
sudo apt install bwm-ngTo run this tool, we will have to run the command "bwm-ng" with superuser permissions.
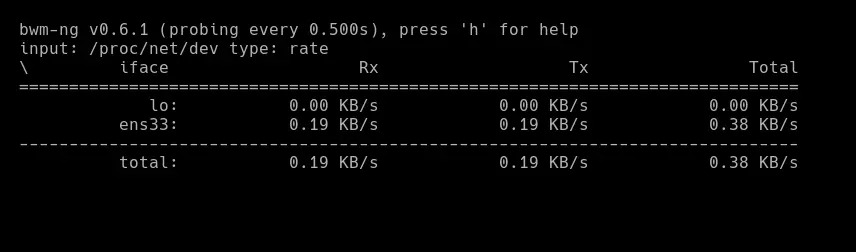
If we press the «h» key we will get help and we can configure different parameters easily and quickly.
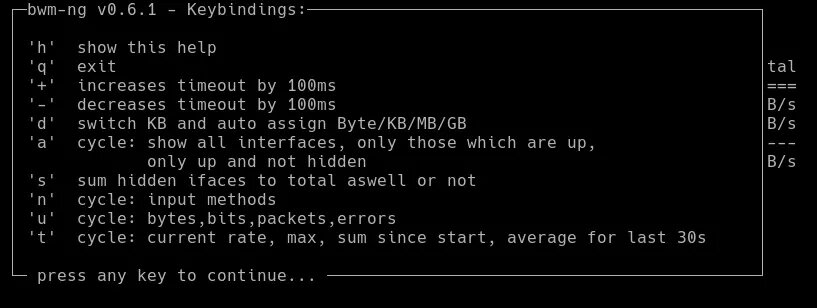
As you have seen, it is a much simpler tool than iptraf, but it is also quite useful.
TCPtrack
Although it is a fairly unknown application, it shows us all the data on the consumption of our connection. To install this tool we must execute the following command in a terminal:
sudo apt install tcptrackTo run this tool, we will have to run the command "tcptrack" with superuser permissions.
![]()
In this case we will have to execute the command together with the interface to be monitored, that is "tcptrack -i ens33" for example.
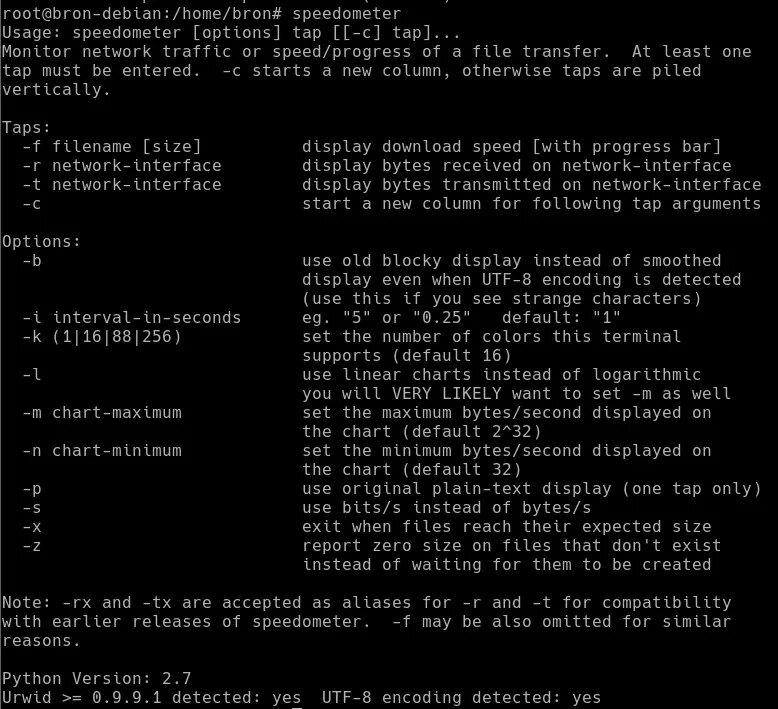
Speedometer
A monitoring program for the network and the packets that are sent and received, which also allows Internet speed tests to be carried out. To install this tool we must execute the following command in a terminal:
sudo apt install speedometerTo run this tool, we will have to run the command "speedometer" with superuser permissions.
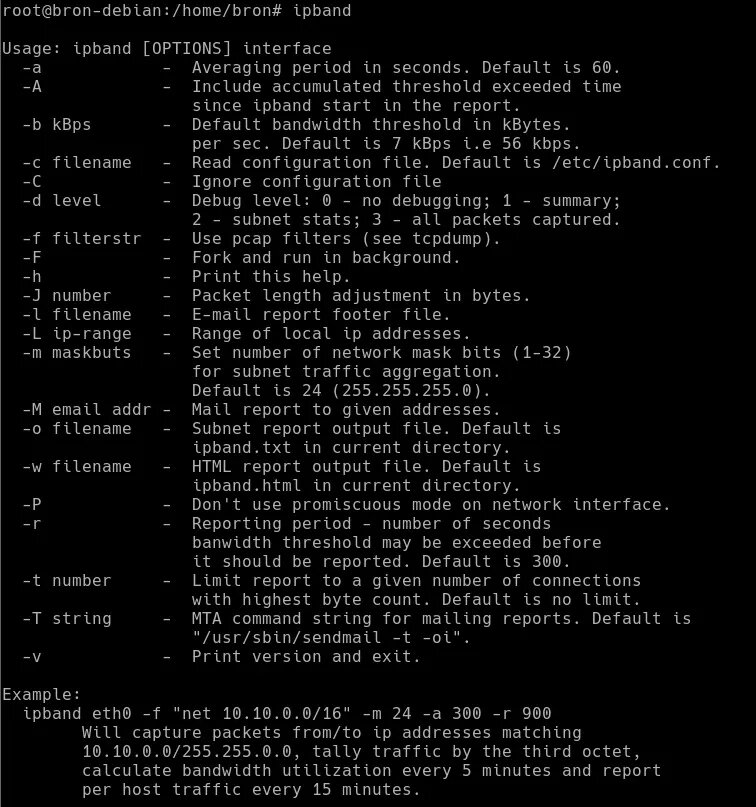
Ipband
An IP traffic monitor aimed at obtaining all the connection data. To install this tool we must execute the following command in a terminal:
sudo apt install ipbandTo run this tool, we will have to execute the command "ipband" with superuser permissions and it will show us the help and everything we can do with this free program.
As you have seen, we have dozens of tools to monitor the network of our server with Linux operating system, our favorite is iptraf because it provides us with a large amount of information.
Now we are going to see all the network monitoring tools with a graphical user interface.
Monitoring tools with graphical user interface
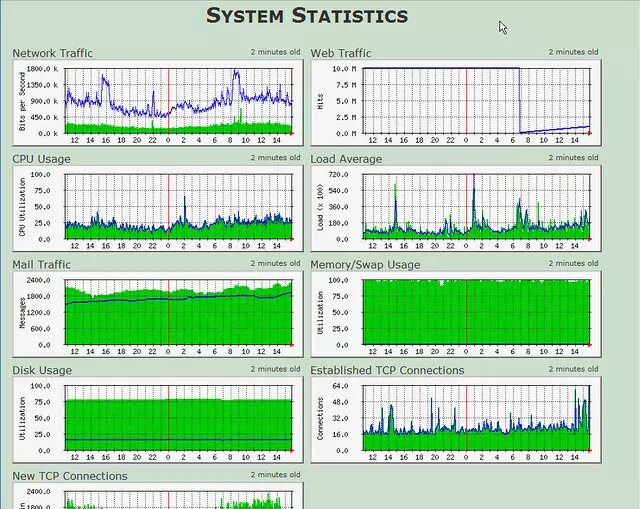
Most monitoring tools for Linux servers with a graphical user interface are based on collecting information through the SNMP protocol, to later "draw" graphs that are very easy to interpret. Therefore, we are going to find a large number of tools that perform this task.
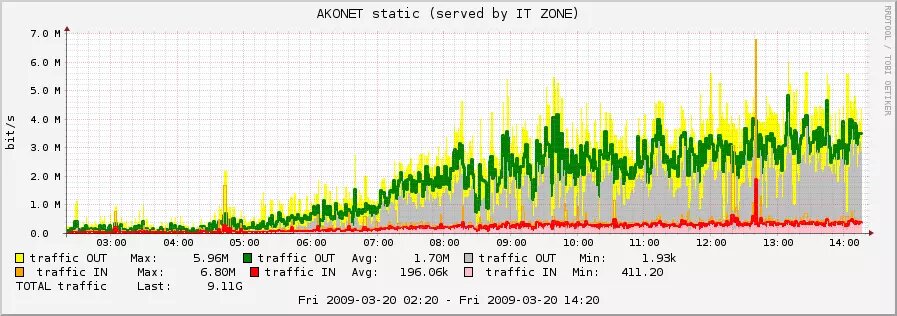
Mrtg
This application, although it is obsolete, continues to collect connection data through the SNMP protocol and draws graphs that are very easy to interpret. To install this tool we must execute the following command in a terminal:
sudo apt install mrtg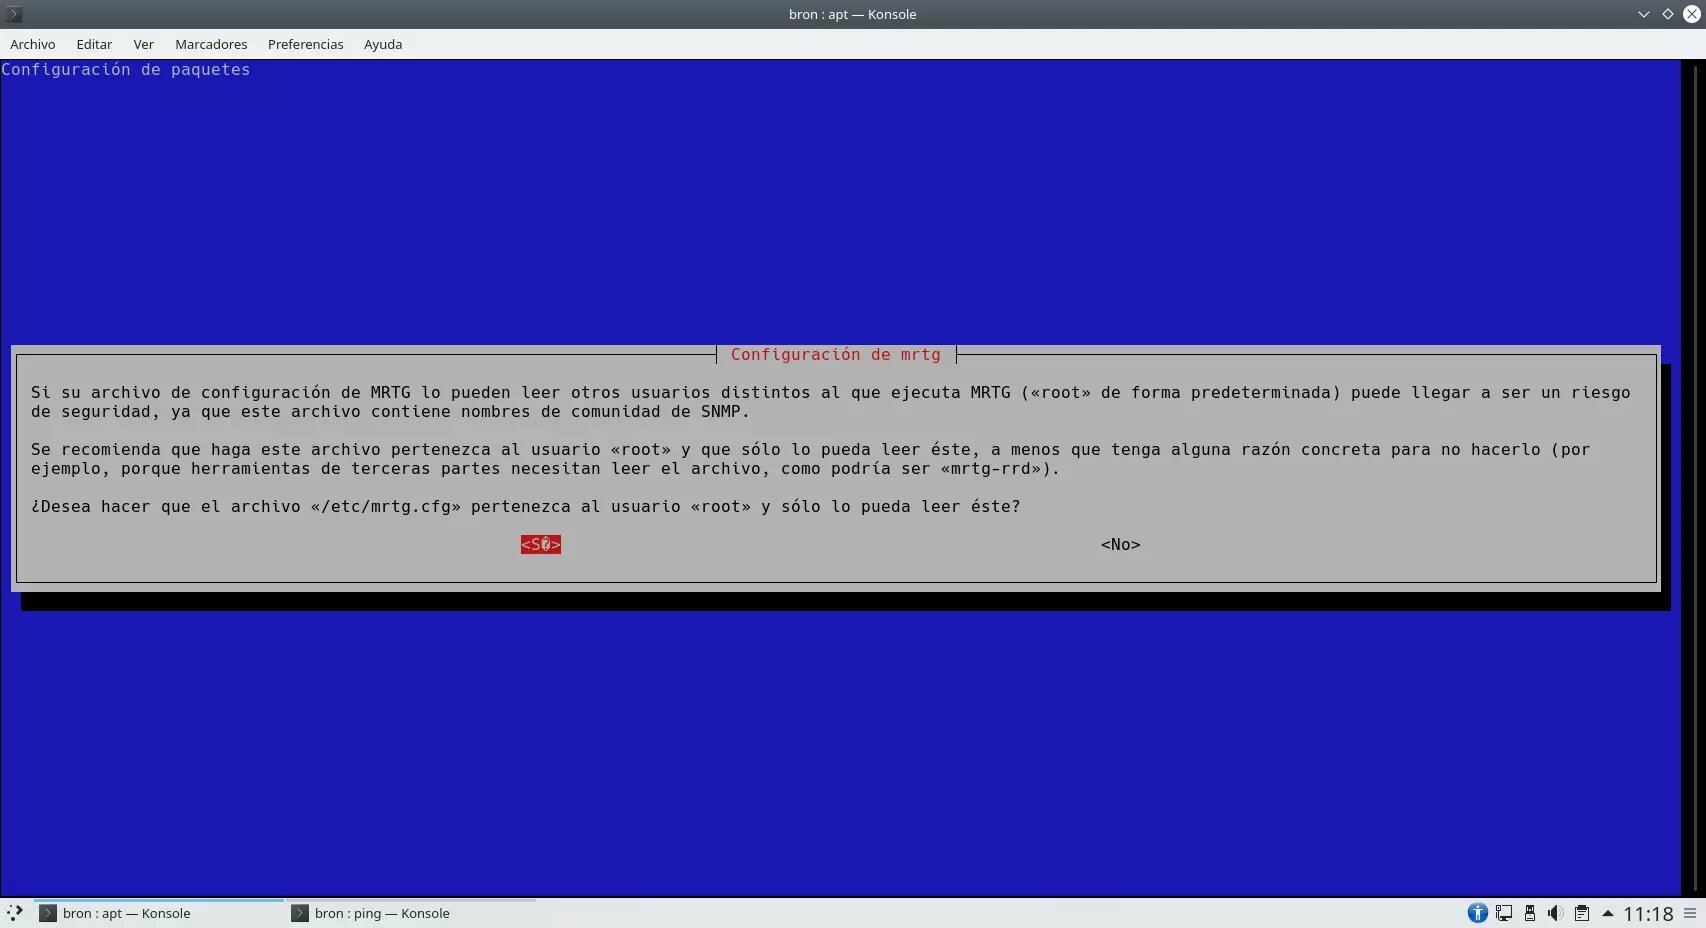
To run this tool, we will have to execute the command "ipband" with superuser permissions and it will show us the help and everything we can do with this free program.
We can get more information about this application and download the packages from the following link.
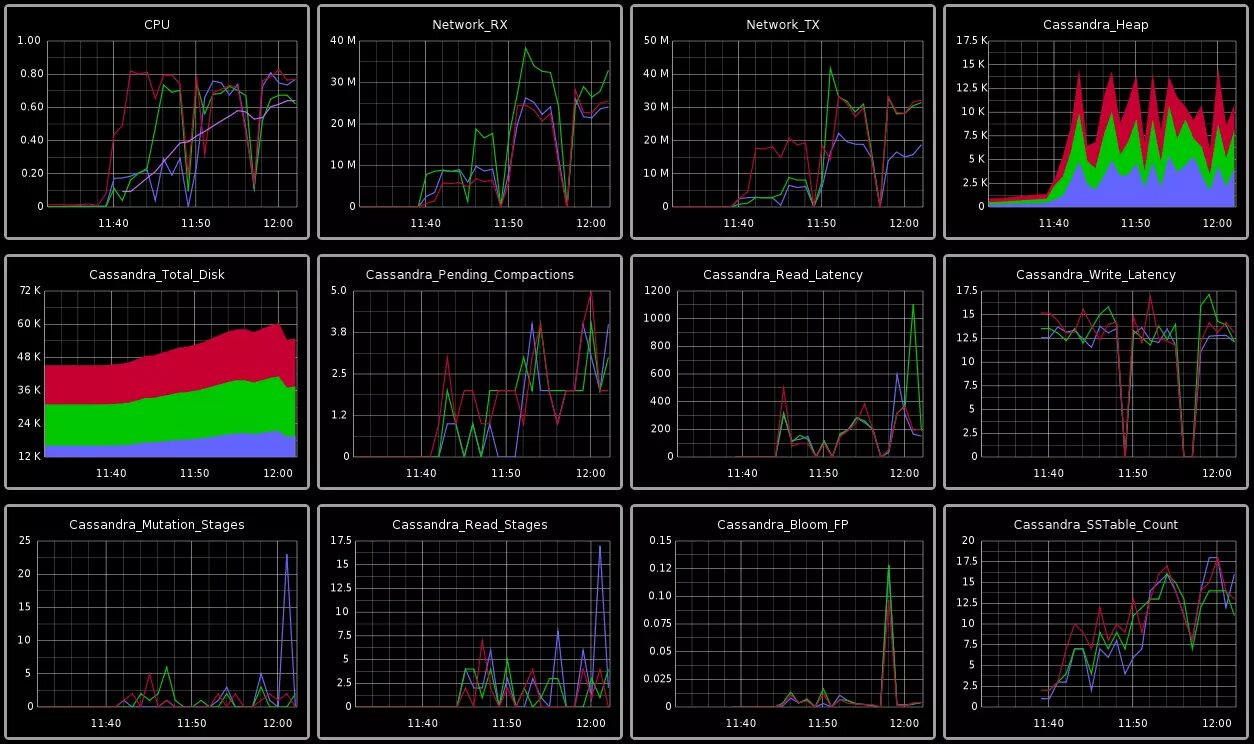
Collectd
One of the most complete tools to monitor a network from Linux. It allows monitoring many aspects of a network, as well as increasing its functions through plugins. It has a client / server function to be able to monitor and analyze peer-to-peer networks. This program is responsible for collecting performance metrics of the system and the application periodically, storing all the information in RRD files for later interpretation.
Collectd is capable of collecting different metrics from various sources, such as the operating system, applications, log files, external devices etc. to later analyze it and even predict a future load of the operating system. If you want fairly intuitive and well-made graphics, this program will also work for you.
We can get more information about this application and download the packages from the following link.
Graphite
It allows drawing any type of traffic from any aspect of the system. The necessary data will be passed to it through a script with a monitoring program since, by default, Graphite does not monitor the network by itself, that is, it only shows the information collected by other monitoring software.
We can get more information about this application and download the packages from the following link.
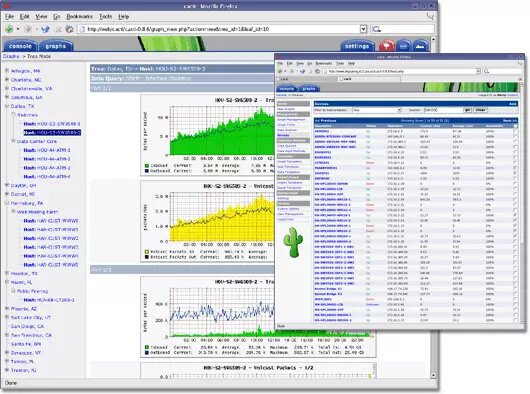
Cacti
Cacti is a complete tool that allows us to draw graphs based on RRD information stored in the operating system. Cacti is a very complete graphical interface for RRDtool, which stores all the necessary information to later create graphs and complete them with information from a MySQL database. All Cacti's graphical interface is designed in PHP, in addition, it also has SNMP support for users who like to create graphs with the popular MRTG program that we have seen previously.
We can get more information about this application and download the packages from the following link.
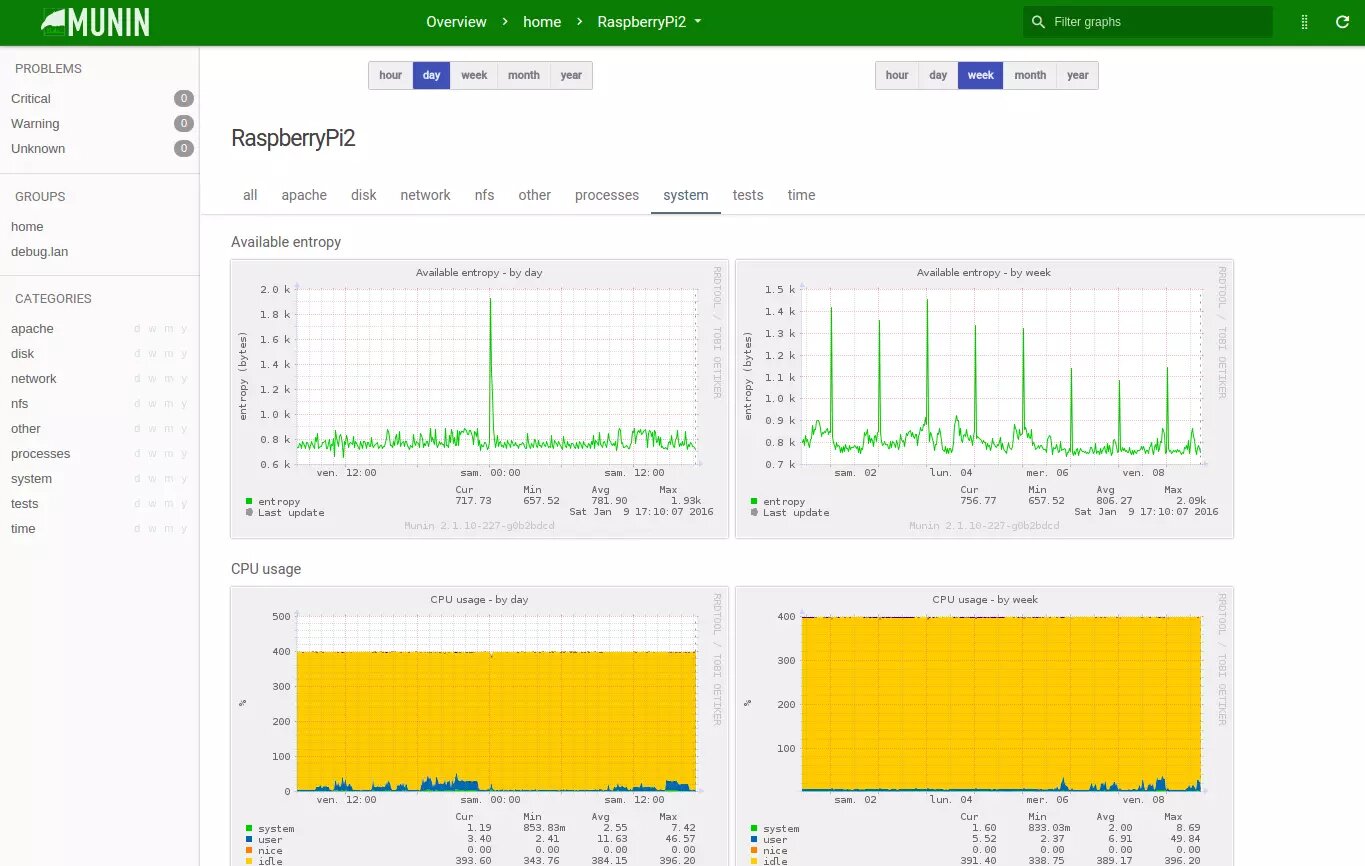
Munin
Munin is a complete network monitoring system for Linux operating systems, this tool is not only in charge of displaying all the RRDtool information, but it is also in charge of collecting all the information. What we like the most about Munin is the large number of plugins we have to monitor different aspects of operating systems, in addition, it has a client / server function to monitor and analyze point-to-point networks.
Munin's graphical user interface is really clean and intuitive, ideal for showing us only what interests us and nothing else, in addition, we can filter and sort the information by hours, days, weeks, months and also years.
We can get more information about this application and download the packages from the following link.
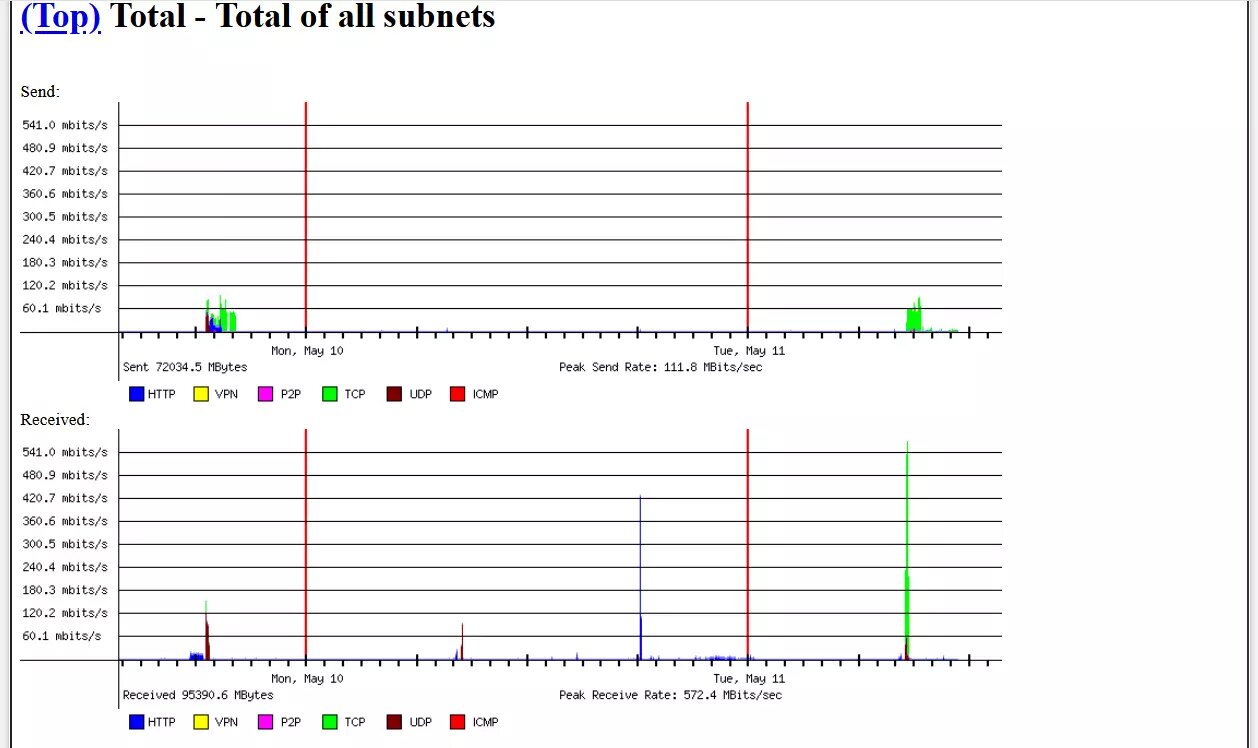
Bandwidthd
Bandwidthd is a very simple tool that will allow us to draw a large number of graphs, but, nevertheless, it does not have many configuration options, which can be an inconvenience for those users who need additional functions. The graphs that it will show us are also very simple, but if we need this "simplicity" the tool will serve us perfectly since it consumes very few resources.
We can get more information about this application and download the packages from the following link.
As you have seen, we have a large number of alternatives to monitor the network in our Linux-based operating system, both through the console and through the graphical user interface where we can see really intuitive and well-designed graphs.
